


“Given that everything changes, we shouldn’t get too carried away when times are good or too despondent when they’re bad.” Richer, Wiser, Happier by William Green
On October 12, 2022, the S&P 500 closed at 3,577. That was roughly 25% below its prior peak, with inflation at multidecade highs, the Fed aggressively hiking, recession forecasts widespread, and sentiment deeply pessimistic.
Four years later, the S&P 500 is up 118% on a price basis, including 19.2% over the last twelve months. The index recently notched its 27th record high of 2026.
Nobody is celebrating the bull market’s 4th birthday.
Headlines are volatile. Politics are volatile. The bond market is volatile. Critics point out the market is underpinned by a handful of stocks propelling major indices higher.
Depending on where you sit (or how you’re invested), this bull market has more room to run or is on the cusp of a blow-up.
The latest wave of headwinds has given the market every reason to sell-off; high oil prices, geopolitical tension, a strong dollar, spiking interest rates, and sticky inflation. Any of these challenges in isolation would give an investor pause; jumble them all together and it’s easy to see why the pessimistic calls are growing louder.
However, underneath it all, it’s been almost ~560 days since our last 10% correction and the market is sniffing all-time highs…

Source: Bespoke Investment Group (10/21/26)
The above chart shows calendar days since the S&P 500’s last 10%+ correction. The daily news cycle has been volatile, but the S&P 500 has been stealthily subdued.
How the Current Bull Market Compares with History
The current bull market’s price appreciation and length is eerily in-line vs. the “average” bull market…
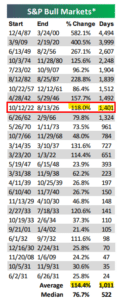
Source: Bespoke Investment Group (10/21/26)
The above chart shows the current bull market (red box) percentage change and length. The bull market that began Oct. 2022 is right in-line with the historical average return of previous bull markets, while running a bit longer by about one year.
How does the current bull market stack up in the 4th year vs. other bull markets?
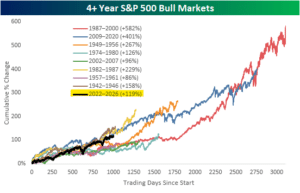
Source: Bespoke Investment Group (10/21/26)
The above chart shows the cumulative percentage change of recent bull markets four years in. The current bull market (black line) doesn’t stick out as parabolic or exhausted vs. previous cycles.
Once a bull hits four years old; how much is left?

Source: Bespoke Investment Group (10/21/26)
The above chart shows the S&P 500’s performance between the 4th year of a bull market and the eventual peak. The median gain after a bull market celebrated its 4th anniversary is ~38%. We should note in six of the eight prior bulls, the gain from the fourth anniversary to the peak was smaller than the gain in the first four years. In other words, the best returns were in the rearview mirror.
What tends to derail bull markets?
- Rates, yields, and inflation. 1966, 2000, and 2022 each ended with rising rates & bond yields doing the damage. That’s why rising bond yields are so worrisome for investors (see “Are Rising Bond Yields a Problem for Stocks?”).
Today, the 10-year Treasury yield is above 5%, the Fed is tightening, and oil is hovering around $100. Rates rising because growth is strong is one thing. Rates rising because inflation won’t settle is a harder setup to overcome.
- AI spending slows. The AI buildout has propelled corporate earnings and is a meaningful share of GDP growth. The rising cost of capital is occurring at the time of record corporate debt issuance to fund the AI complex. Some of these indebted companies are seeing their borrowing costs skyrocket as investors question borrowing capacity, credit quality, and rosy growth projections.
There are many folks out there trying to predict what happens next. We hope this provides historical context on how this bull market stacks up with history. For those that are retired (or about to retire), our answer is consistent. Size positions so you never have to guess. Be true to your risk profile. Don’t chase into the best performing themes. Preparedness beats prediction.
If you want to learn more about how we build resilient portfolios for retirees, shoot us a note at [email protected].


Waverly Quarterly Review & Market Outlook Q3 2026
In this video from Clay McDaniel, CFA®, Partner, Chief Investment Officer at Waverly Advisors, LLC, he discusses key takeaways from…