
Putting the Sell Off in Perspective
 “Instead of fixating on short-term gains or beating benchmarks, we should place greater emphasis on becoming shock resistant, avoiding ruin, and staying in the game.” – William Green, author of Richer, Wiser, Happier
Recent market volatility has raised concerns among investors. The 24/7 news cycle tends to amplify scary headlines and highlight stocks selling off, but history offers a more grounded perspective: drawdowns are not a bug in the system or a sign that something is broken—they are the cost of admission of equity investing.
Even in strong years, the S&P 500 experiences meaningful pullbacks.
Since 1980, the average intra-year drawdown for the S&P 500 has been approximately 14%.
- These drawdowns occur almost every year
- They often happen without a corresponding recession
- Markets frequently finish the year positive despite interim declines
The humble investor knows that volatility is not the same as permanent loss of capital, which allows them to stick to their long-term investment plan during uncomfortable periods.
The “all systems go; investors have a license to uninterrupted gains,” sign does not exist for the equity investor. Historically, markets have had plenty of reasons to sell off.

Source: Carson Wealth, Ryan Detrick
The above chart shows the Dow Jones Industrial Average (since 1900) with major geopolitical events. In the 24/7 news cycle, it’s not hard to find what could go wrong, but markets have been historically resilient. It’s been said that everything feels unprecedented when you haven’t engaged with history.
In each case, the drawdown felt justified—and yet, in each case, markets eventually stabilized and moved higher.
This gives investors a useful probability framework for making sense of market declines…
- 5–10% pullback – Occurs in roughly 85–95% of years.
- 10–15% correction – Occurs in ~40–60% of years. This is where it might get uncomfortable, but within a normal range of outcomes.
- 20%+ decline (bear market) – Occurs in roughly 20–25% of years (think COVID, inflation & rate shock 2022, and spring 2025).
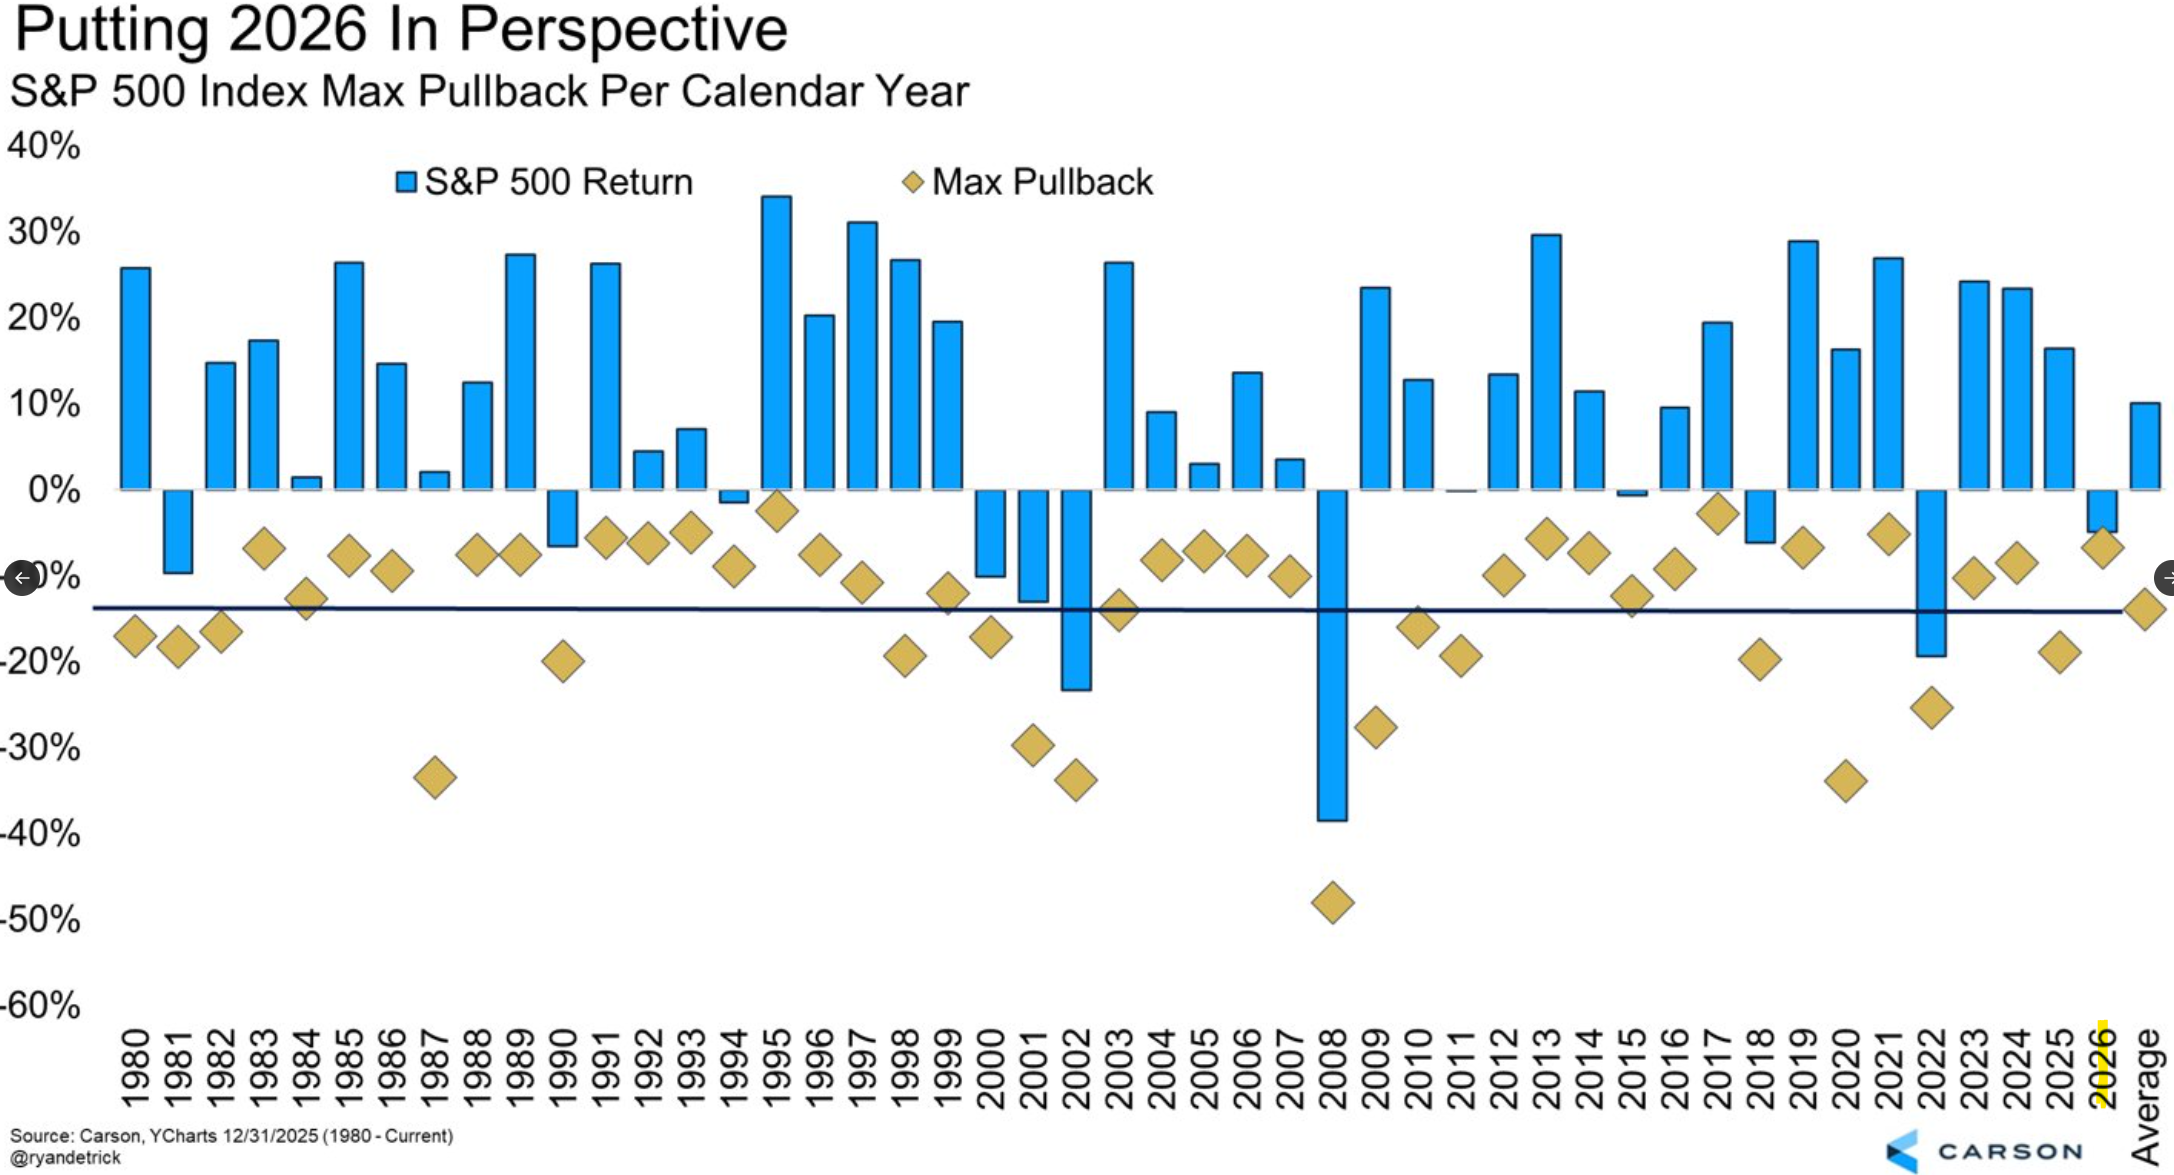
We can evaluate every intra-year market decline since 1980 and how the S&P 500 finished the year…
Source: Carson Wealth, Ryan Detrick
The above graph shows S&P 500 intra year drawdowns (gold diamonds) and how the index finished (blue bar) the year. The average intra year drawdown for the S&P 500 is around 14%. It’s common for markets to pullback, only to finish the year in positive territory.
This drives home the point; volatility is the cost of admission for the equity investor.
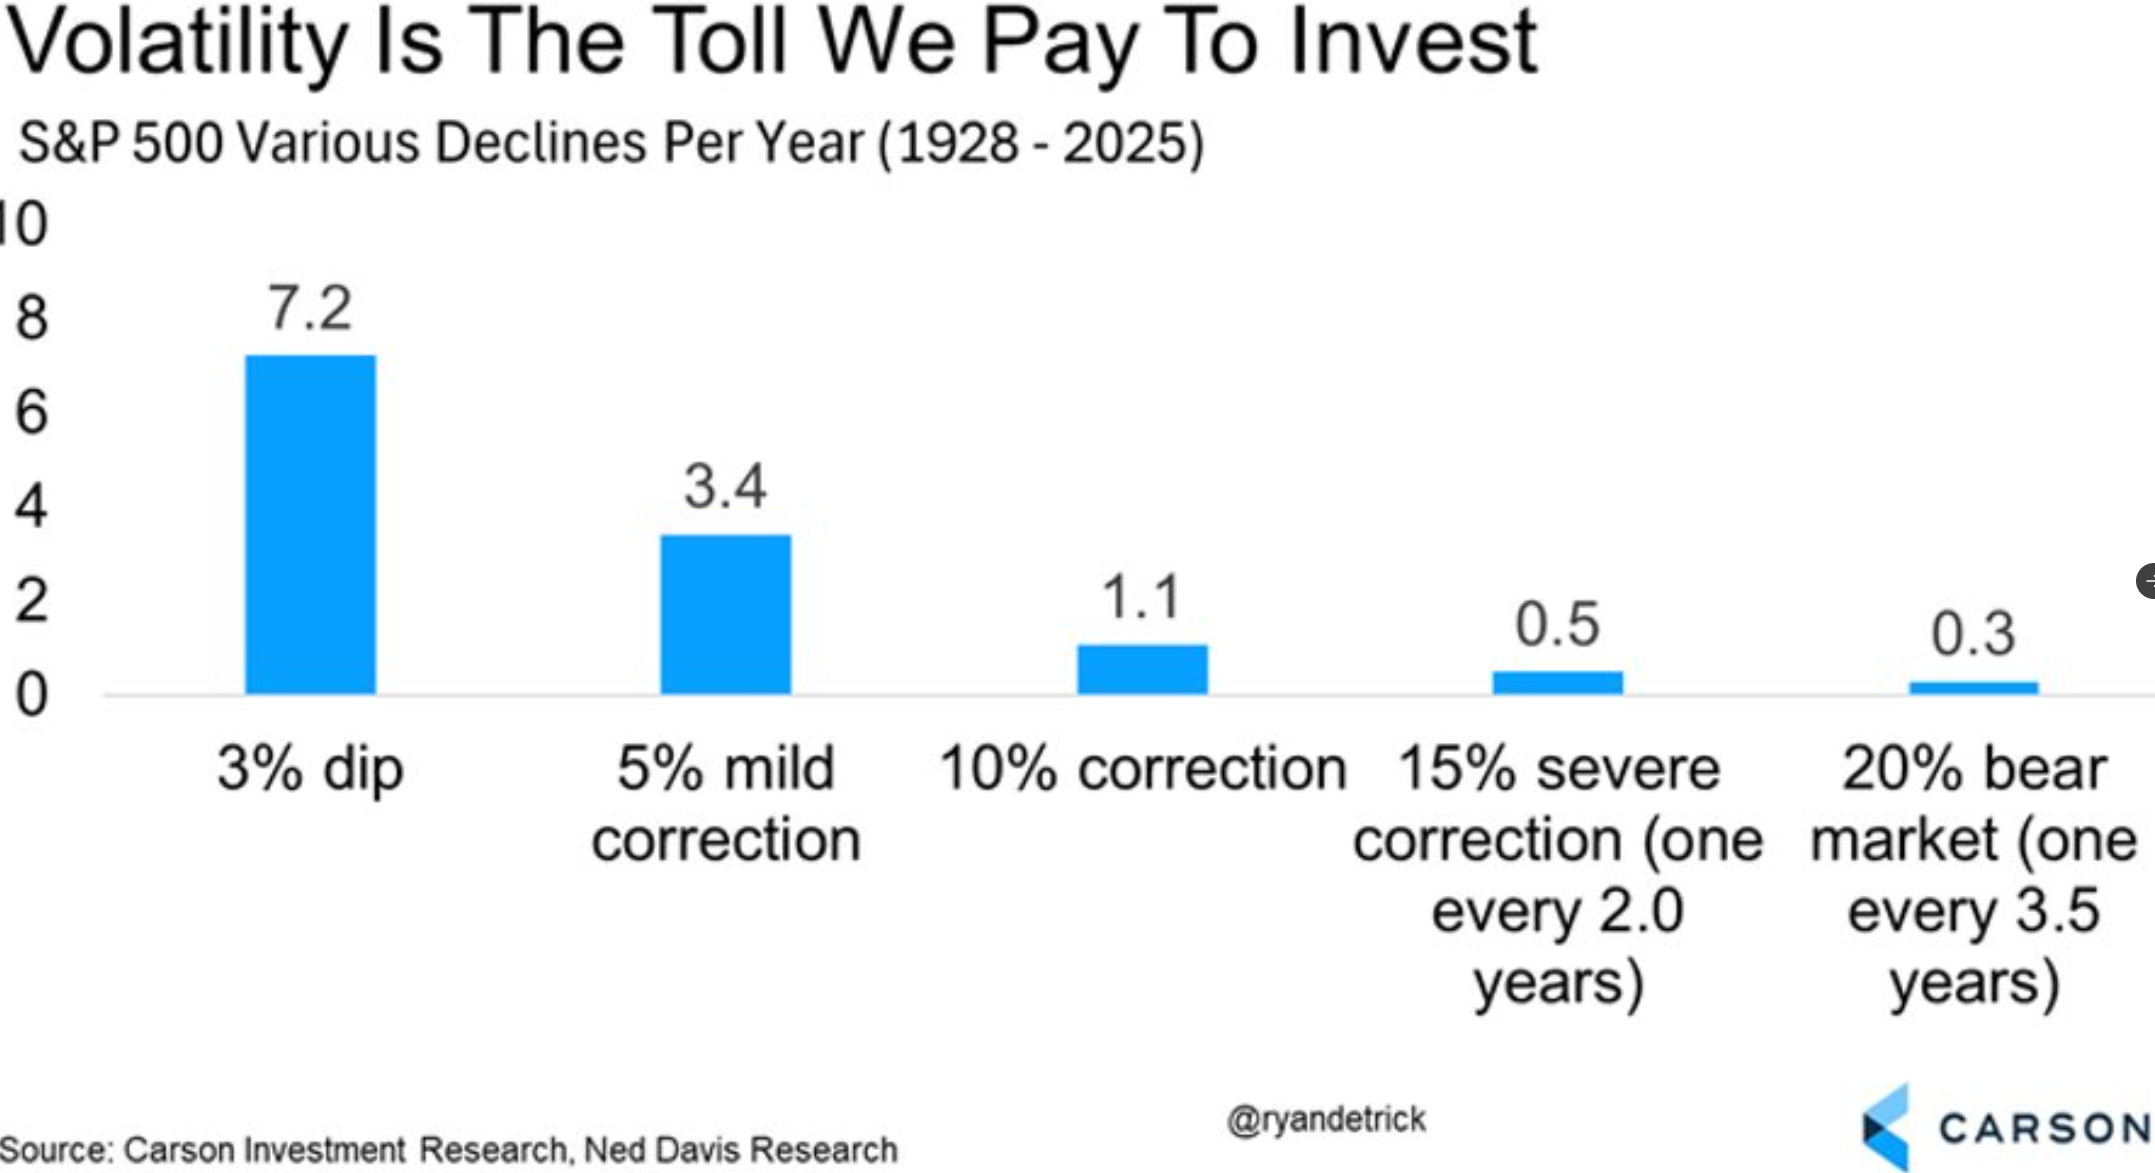
Source: Carson Wealth, Ryan Detrick
The above graph shows the frequency of S&P 500 declines (top number) and the depth of the drawdown in any given year (1928-2025). For example, 5% corrections occur 3.4 times per year on average. A 10% correction occurs about once per year on average.
How does the current drawdown compare to history?
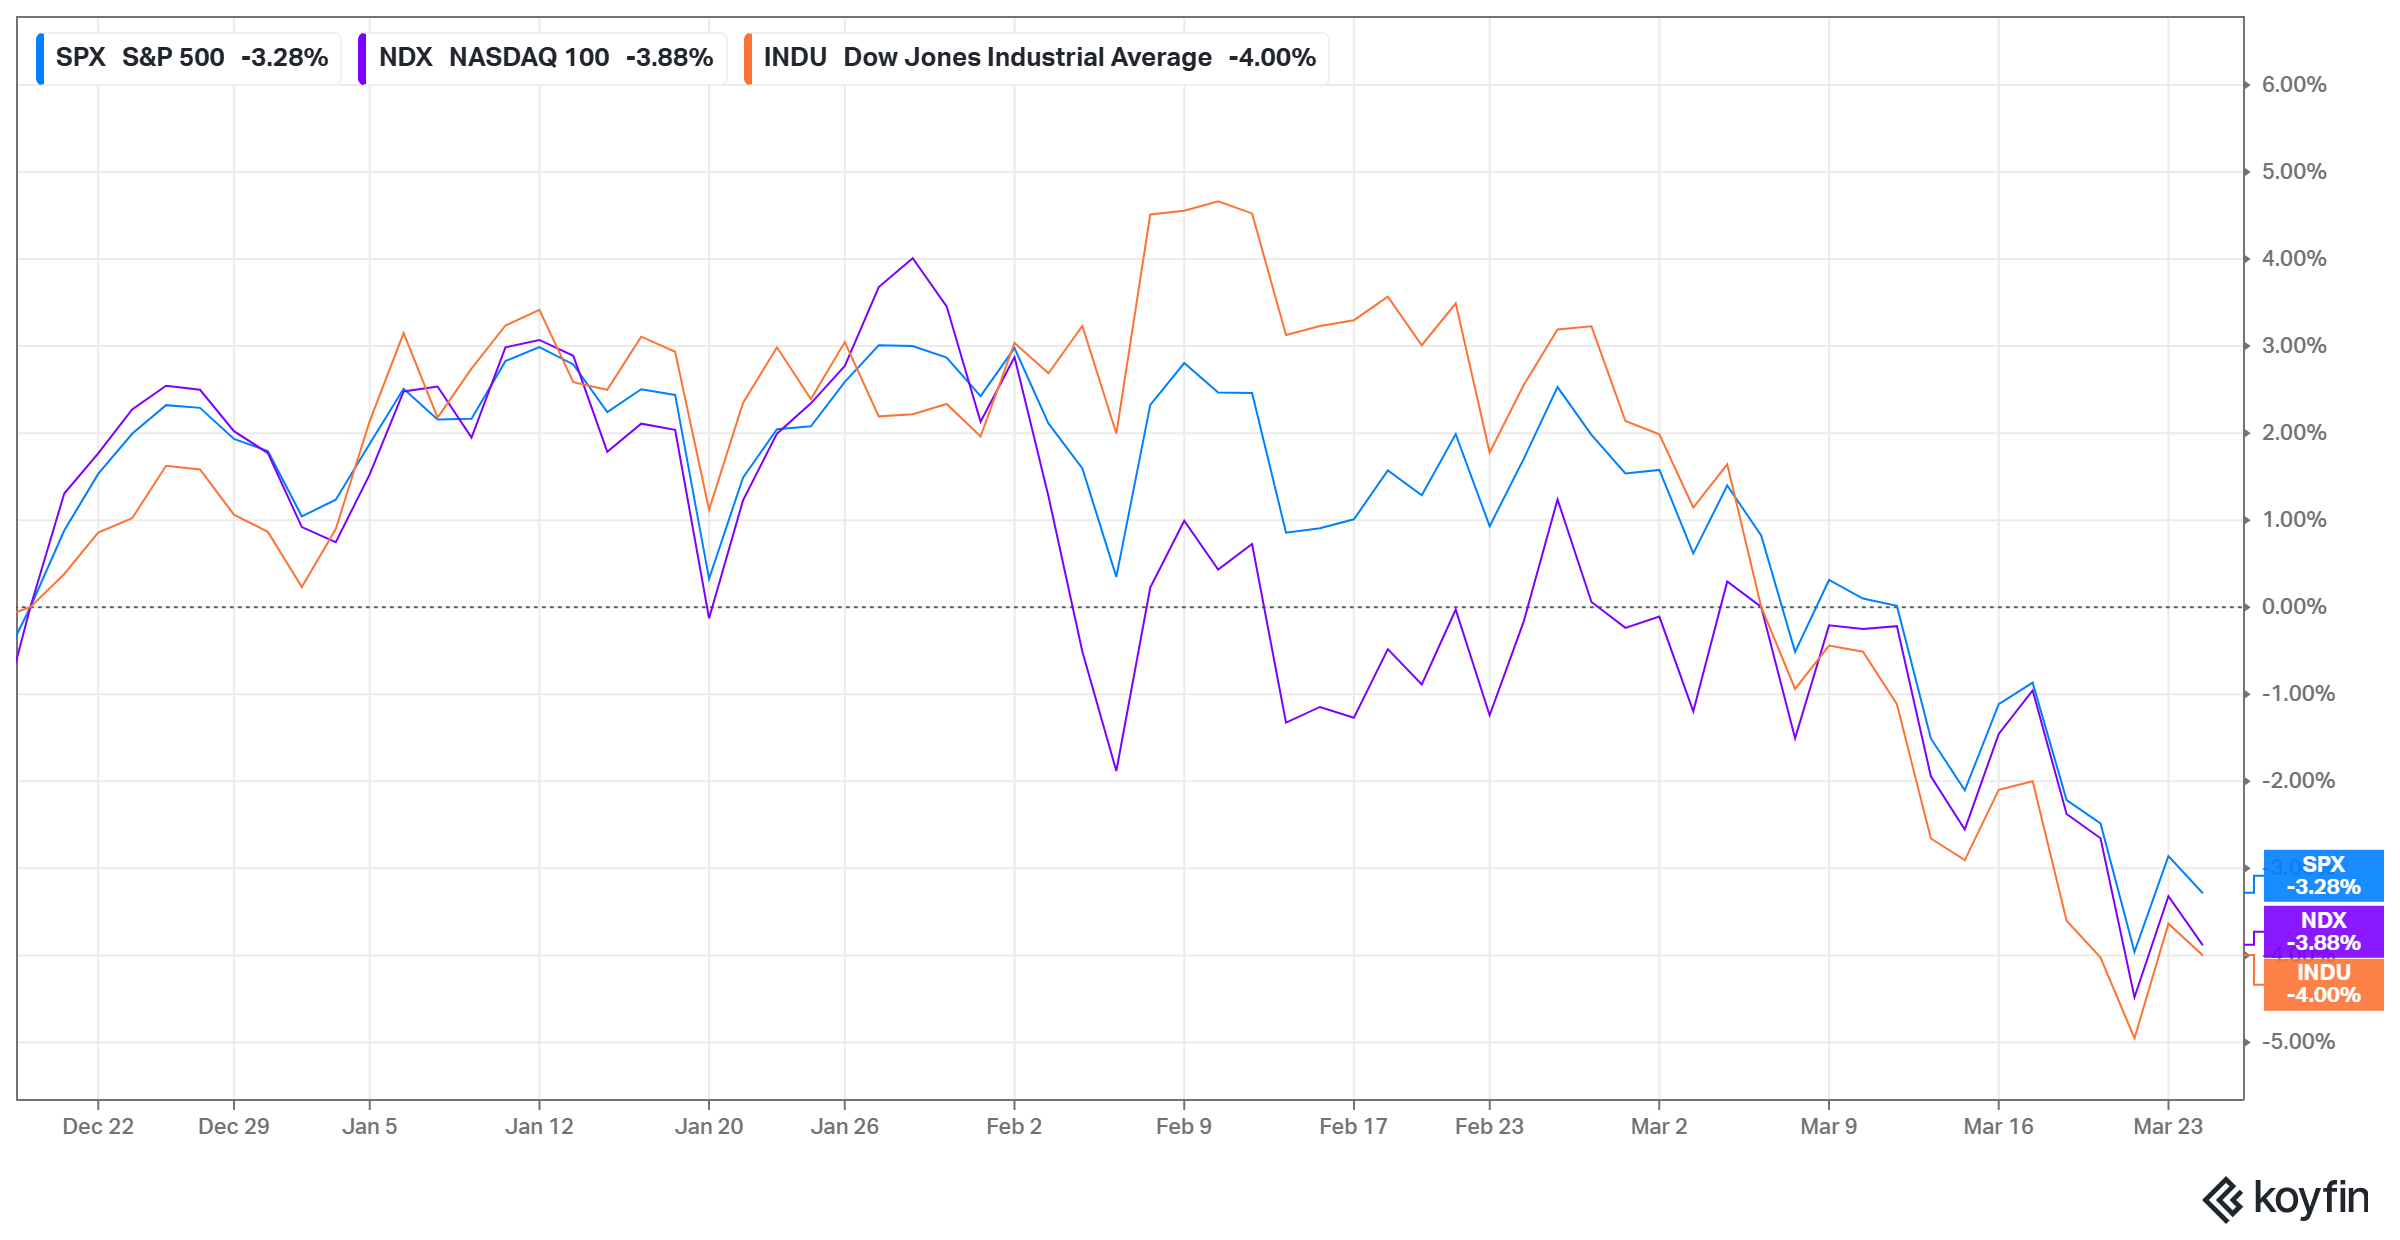 Source: Koyfin
The above chart shows year-to-date price movements for the S&P 500 (blue), Nasdaq (purple), and the Dow Jones Industrial Average (orange). As of 3/24/26, popular U.S. indices have sold off by ~7%; this is well within the normal volatility range.
But what if things get worse?
Here’s how often a pullback turns into something bigger…
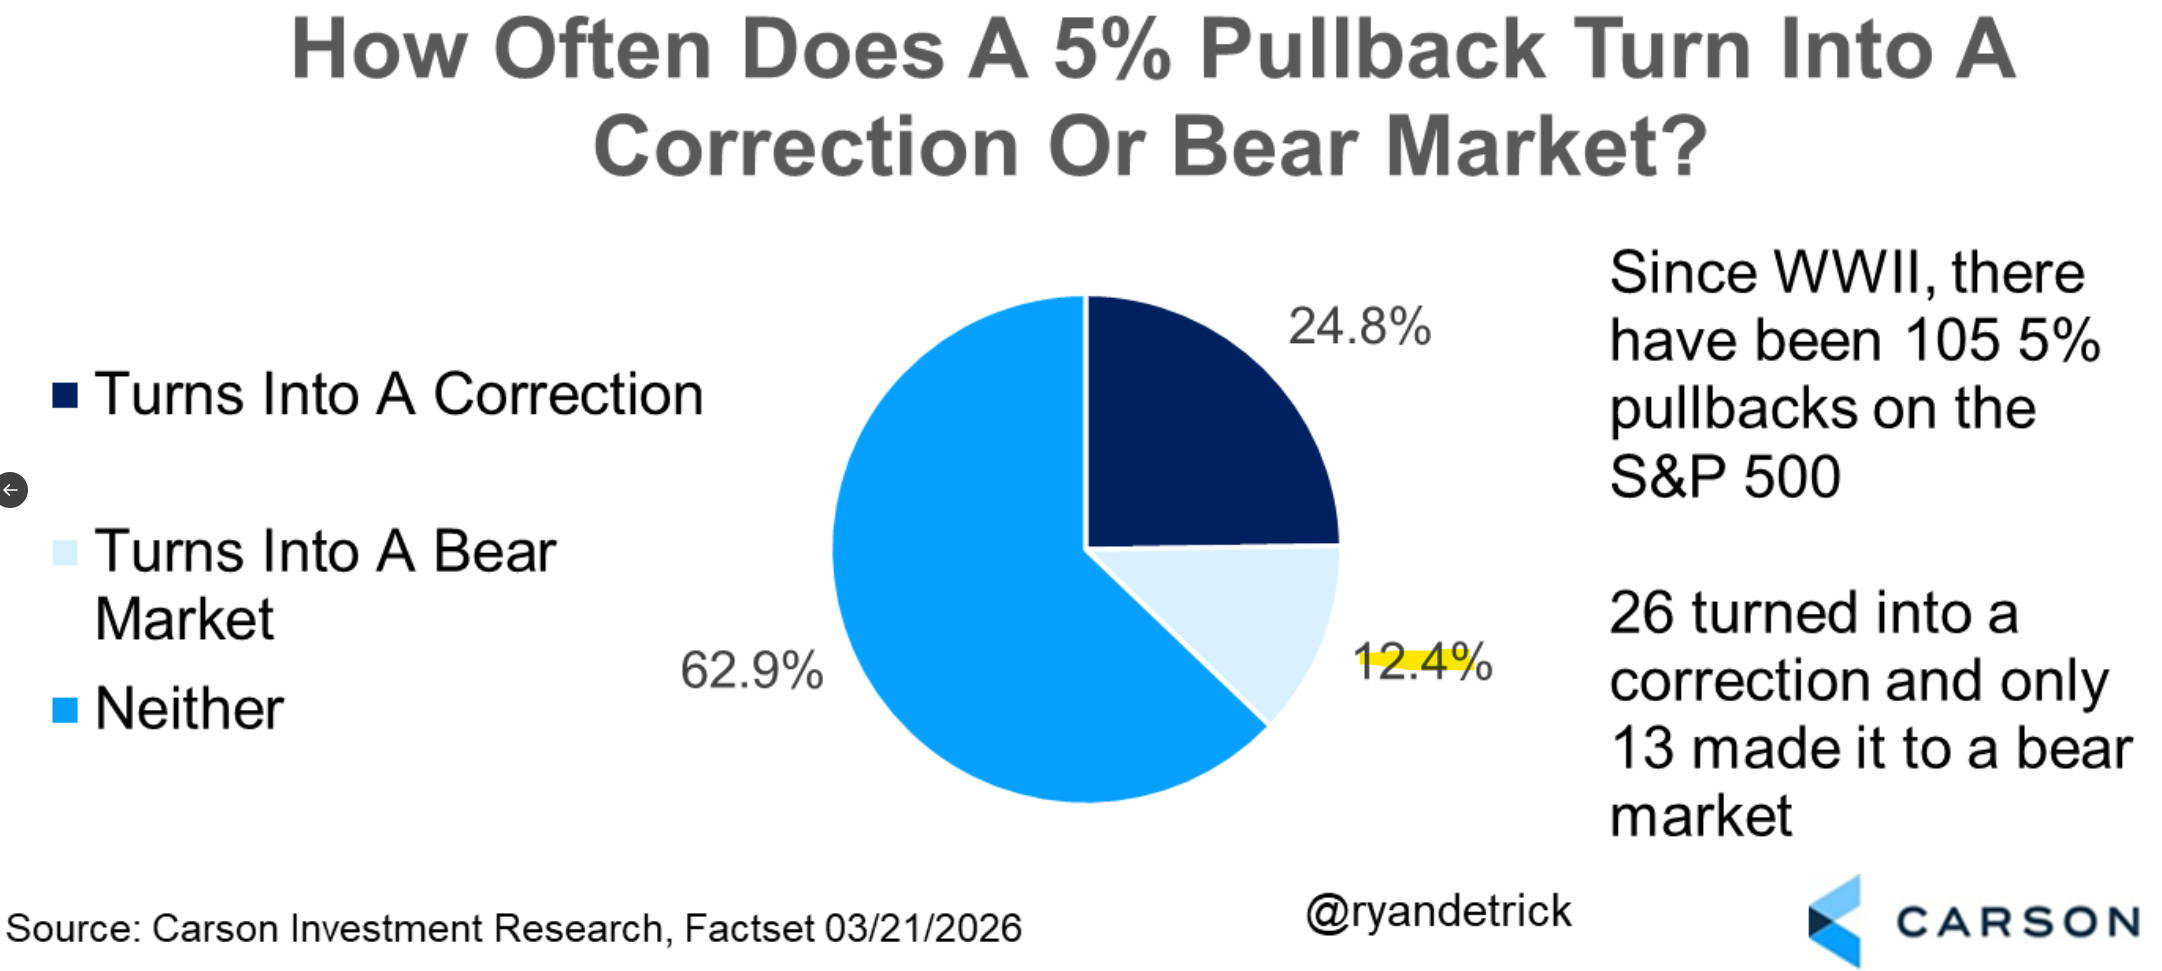
Source: Carson Wealth, Ryan Detrick
The above graph shows how often a 5% pullback turns into a deeper correction. Since WWII, there have been 105 5% pullbacks in the S&P 500. About 12% of the time, those corrections turned into bear markets (-20%).
How can we better equip ourselves and portfolio for volatility?
- Stay true to your investment personality. If you’re a conservative investor, build a conservative portfolio. You want an asset allocation that you can stick to in every environment (not just the good times).
- If you’re uncomfortable with a 7% pullback (half of the average drawdown over the past 95 years), you’re probably taking too much risk. Go back to the drawing board and be honest about your capacity to take risk.
- Engage more with history and consume less media. Put the phone down and turn the TV off. If you want to feel worse, watch the news.
- Despite the recent turmoil, U.S. markets are still within shouting distance of all-time highs. This is a golden opportunity to revisit risk exposures, position sizing, and knowing what you own.
Market drawdowns are not a signal that something is broken—they are the price of admission for capturing long-term equity returns.
If you want to understand your risk exposures and how to mitigate portfolio drawdowns, shoot us a note [email protected].

Written by Nik Schuurmans, CFA®
Nik Schuurmans joined Waverly Advisors in January 2026 after Pure Portfolios was acquired by Waverly Advisors, LLC. As Partner and Wealth Advisor, Nik operates using a transparent and pioneering fee structure, to provide a modern wealth management experience for every client. Nik believes access to professional advice should not come with exorbitant fees, misaligned incentives, and conflicts of interest. Learn more about Nik…
Important Disclosure Information – Waverly Advisors (waverly-advisors.com)
Disclosure: Past performance may not be indicative of future results. The opinions expressed in this commentary reflect information available at the time it was written and should be used as a reference only. Due to various factors, including changing market conditions, economic conditions, and/or applicable laws, the content may no longer be reflective of current opinions or positions. Moreover, you should not assume that any discussion or information contained in this commentary serves as the receipt of, or as a substitute for, personalized investment advice from Waverly. If you have any questions regarding the applicability of any specific issue discussed above to your individual situation, you are encouraged to consult with your Waverly adviser or the professional advisor of your choosing. A copy of Waverly’s current written disclosure Brochure discussing our advisory services and fees is available for review upon request or by visiting https://waverly-advisors.com/ADV-Part-2A-Brochure. Please see additional important disclosures on the last page of this report.