
Starting Point Matters
“Some of the worst allocation decisions get made during prosperous times.” – Morgan Housel, author
 “
““I’m looking to retire by the age of 55. I want to pad my investment portfolio over the next few years. I will have $100,000 per year to invest. What should I do?”
“Dude, just buy the S&P 500 and chill.”
This is a common exchange within the financial community on X.com.
The sentiment is consistent with prospective client portfolios we analyze. It’s not a stretch to say 9/10 folks are making a massive bet on U.S. Large Caps & Technology (see “Risk of Concentration”).
The evidence isn’t simply anecdotal. Bank of America’s private client allocation is sitting at a cycle high in equities…
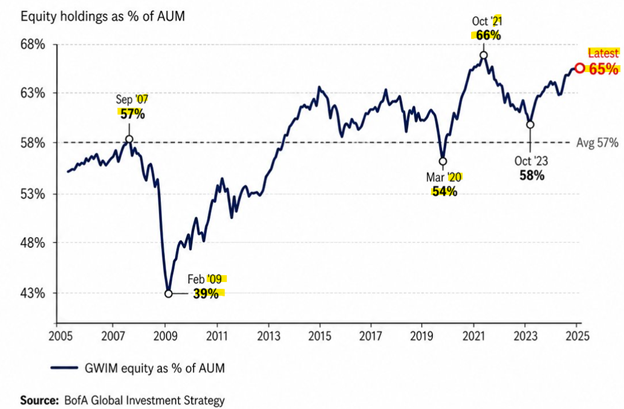
The above chart shows Bank of America’s private client percentage allocation to equities. The graph does not break down exposure by country, but it’s a safe bet that the bulk of equities are likely U.S. domiciled companies. Notice how stocks are over-owned prior to every recent market crash and under-owned after every market crash. Even clients advised by the best and brightest minds of Wall Street are susceptible to performance chasing, market timing, and emotional decision making.
On one hand, the overallocation to U.S. stocks makes sense. The S&P 500 has been a runaway juggernaut over the past decade. The market cap index has posted a 15.30% return annualized over the past 10 years.
That’s a 15% return every year for the last 10 years. That’s one of the strongest decades in modern market history.
The trap for investors is thinking the next 10 years will look like the last 10 years. For the humble investor, the current setup might raise some eyebrows.
Paul Tudor Jones, one of the greatest hedge fund managers of this era, recently stated,
“The United States is over equitized. It’s going to be harder to make money over the next 10 years.”
Tudor is referencing U.S. Total Stock Market Cap relative to GDP. The ratio has never been higher (also known as the Buffett indicator) …

Source: MacroMicro
The above graph shows the total value of public U.S. companies relative to Gross Domestic Product (GDP). The ratio is a favorite of Warren Buffett to measure the attractiveness of public stocks vs. total economic output. When the ratio is high, stocks are deemed overvalued. It’s not a surprise Buffett’s Berkshire is sitting on almost $400 billion in cash waiting for a better setup.
Historically, it is harder to make money when stocks are fully or overvalued. However, valuation is a lousy timing tool. What’s expensive can stay expensive. What’s cheap can stay cheap. Over longer periods, starting point does matter.
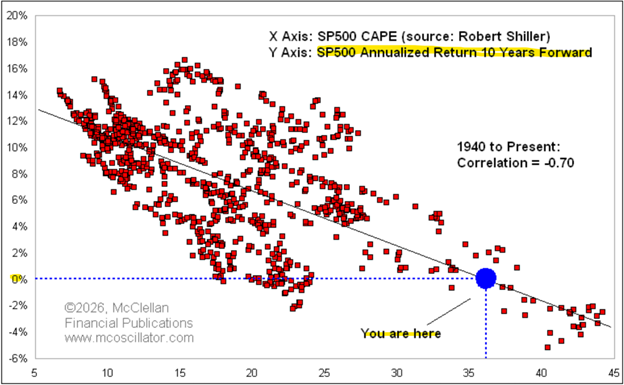
Source: McClellan Financial
The above chart shows forward annualized 10-year returns (vertical y-axis) at various levels of valuation. The further we move to the right on the bottom axis (x-axis), the more expensive the S&P 500. At the current cyclically adjusted price to earnings ratio of >35 (blue circle), future 10-year returns for the S&P 500 are 0% per year (that’s a 0% return for a decade!).
Simply stated, if a buyer grossly overpays for the asset, it could put a lid on future returns.
To recap…
- The S&P 500 has been on a historically torrid run over the past decade
- Many investors, from retail to professional, ‘over-own’ U.S. stocks
- The Buffett indicator measuring the value of U.S. companies relative to GDP has never been higher (Tudor Jones called the U.S. “over equitized”)
- Future 10-year returns for the S&P 500 from current valuation levels hover around 0% per year
- Valuation is a lousy timing tool, but over the long-term starting point matters
We believe investors should research investing in U.S. Large caps, U.S. Technology and AI. It’s been a great place to be. It could result in massive productivity gains for the economy.
However, history isn’t kind to future returns from these historically elevated levels.
If you’re a retiree with 60% exposure to Technology stocks, use performance as the only criteria to determine success or failure, and think the next 10 years will look like the last 10; you’re probably going to be disappointed.
If you struggle with risk management, position sizing, or don’t know what you own, shoot us a note at [email protected].
 Written by Nik Schuurmans, CFA®
Nik Schuurmans joined Waverly Advisors in January 2026 after Pure Portfolios was acquired by Waverly Advisors, LLC. As Partner and Wealth Advisor, Nik operates using a transparent and pioneering fee structure, to provide a modern wealth management experience for every client. Nik believes access to professional advice should not come with exorbitant fees, misaligned incentives, and conflicts of interest. Learn more about Nik…
Important Disclosure Information – Waverly Advisors (waverly-advisors.com)
Disclosure: Past performance may not be indicative of future results. The opinions expressed in this commentary reflect information available at the time it was written and should be used as a reference only. Due to various factors, including changing market conditions, economic conditions, and/or applicable laws, the content may no longer be reflective of current opinions or positions. Moreover, you should not assume that any discussion or information contained in this commentary serves as the receipt of, or as a substitute for, personalized investment advice from Waverly. If you have any questions regarding the applicability of any specific issue discussed above to your individual situation, you are encouraged to consult with your Waverly adviser or the professional advisor of your choosing. A copy of Waverly’s current written disclosure Brochure discussing our advisory services and fees is available for review upon request or by visiting https://waverly-advisors.com/ADV-Part-2A-Brochure. Please see additional important disclosures on the last page of this report.